U.S. Child Poverty Rate Reaches Prerecession Level

The nation’s child poverty rate has fallen to 18% — a figure that translates to slightly more than 13 million kids living in poverty, according to data from the 2017 American Community Survey. The last time the nation saw such a low child poverty rate was in 2007, just before the Great Recession.
Across the country in 2017, 15 states reported child poverty rates below prerecession levels while seven states matched their prerecession rate. In 28 states and the District of Columbia, however, the percentage of children growing up poor still hovers above prerecession rates.
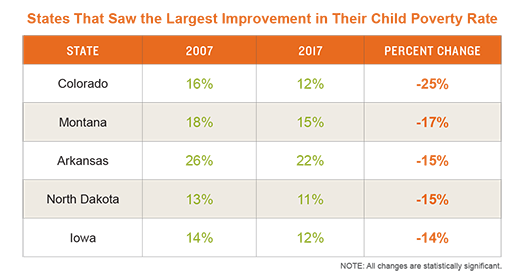
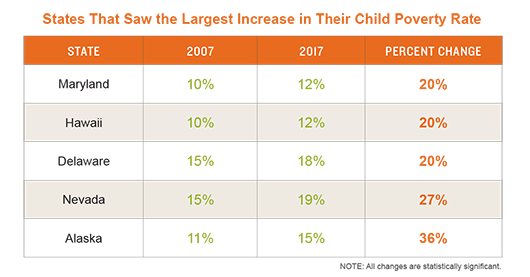
Comparing data from 2007 to 2017, Arkansas, Colorado, Iowa, Montana and North Dakota saw the greatest declines in child poverty rates while Alaska, Delaware, Hawaii, Maryland and Nevada saw the largest jumps.


More than half of the 50 largest U.S. cities saw their child poverty rates drop below prerecession levels.
Even with these improvements, specific racial and ethnic groups still experienced child poverty at a rate that exceeded the national average. This includes children 5 and younger (20% are living in poverty) as well as children who are American Indian (33%), African American (33%) and Latino (26%).
If kids are young and African-American or American Indian, they are among the most likely to live in poverty, with 37% growing up poor.
Living in poverty — which equates to annual earnings of less than $24,858 in 2017 for a family of four — is one of the single greatest threats to child development. Policies such as the Earned Income Tax Credit and the Affordable Care Act, as well as efforts to raise the minimum wage, can help reduce the poverty rate and support opportunity and economic security for all Americans.
2017 Child Poverty Indicators
Access poverty data on the KIDS COUNT Data Center:


