A National Profile of Youth and Young Adults

The age span of roughly 14 to 24 marks a critical stage of development. During this phase, youth and young adults experience profound cognitive, biological and physiological changes. At the same time, these young people must navigate increasing autonomy, forming their identities, developing relationship and life skills, advancing their education, acquiring job training and more. For many young people, this phase is further complicated by financial hardship, mental health issues, experiences of racism or discrimination and other challenges. However, this vulnerable and formative period is also a window of opportunity for parents, caregivers and adults in the community — as well as for programs, investments and policies — to support young people on a positive path for the future.
As part of the Annie E. Casey Foundation’s commitment to fostering the success of youth and young adults, the KIDS COUNT® Data Center offers more than 60 indicators on the health and well-being of young people ages 14 to 24. This dataset covers topics ranging from employment, poverty and education to health, mental health, and family and community issues. Many of these indicators are available by race and ethnicity or family nativity, as well, highlighting enduring inequities for youth of color. To help advocates, policymakers, service providers and others understand how youth experiences vary across the country, the data are also provided by state and, in some cases, by territory, city and congressional district. This profile spotlights key findings from this dataset.
Key Findings
Many issues continue to be serious concerns for young people in America, including financial security, housing affordability, mental health, substance abuse, death rates and access to health insurance, among others. Racial and ethnic inequities permeate virtually every issue facing youth and young adults. Socioeconomic status and where youth live also greatly impact their opportunities or barriers to success. At the same time, the country has made meaningful progress in other areas, such as improving high school graduation rates, increasing young adult civic engagement and reducing rates of poverty, teen births and juvenile detention. Additional strides have been made in supporting young people in the transition to adulthood, although much more work is needed in this area, particularly for youth aging out of foster care.
Demographics
- Youth and young adults make up nearly 50 million Americans: In 2023, 48.2 million young people ages 14 to 24 lived in the United States. Their population size has remained around 47 to 48 million over the last decade. The majority of this group — 30.5 million in 2023 — are young adults ages 18 to 24.
- They are becoming more racially and ethnically diverse: The KIDS COUNT Data Center provides racial and ethnic breakdowns for young adults ages 18 to 24, just over half of whom are white (52% in 2023). About one-fourth (24%) are Latino, 14% are Black, 6% are Asian, 4% are multiracial, 1% are American Indian or Alaska Native and less than 0.5% are Native Hawaiian and other Pacific Islander. Between 2010 and 2023, the share of white young adults decreased by 5 percentage points, while the share of Latinos increased by 4 percentage points. Shares of Asian and multiracial young adults also increased one and 2 percentage points, respectively.
- More than 1 in 5 youth and young adults live in immigrant households: Among young people ages 14 to 24, 22% are immigrants or live with at least one foreign-born parent, i.e., they are first- or second-generation immigrants, according to 2018–22 data. This figure has held steady in recent years but is up slightly from 20% in 2006-10. More than half (53%) of these estimated 10.8 million young people live in four states: California, Texas, New York and Florida.
- Three-fourths of Asian and Pacific Islander young people are first- or second-generation immigrants: In 2018–22, 75% of Asian and Pacific Islander youth and young adults ages 14 to 24 were immigrants or lived with immigrant parents. The same was true for 50% of Latino and 34% of multiracial young people in this age group, followed by 21% of American Indian or Alaska Native, 15% of Black and 6% of white youth and young adults.
Read our series about Asian and Pacific Islander youth
Poverty and Income
- The poverty rate for young adults dropped by more than 25% between 2010 and 2023: Among young people ages 18 to 24, poverty rates peaked at 26% during 2010 to 2012, then steadily declined to 19% in 2021 and stayed at this rate through 2023. Although young adult poverty rates have improved in nearly all states since 2010, as well, figures remained at 25% or higher in three states in 2023: Montana (25%), West Virginia (25%) and Louisiana (28%). The federal poverty definition uses thresholds based on family size and composition, e.g., it was $30,900 for a family of two adults and two children in 2023. Households can earn well above this poverty level and still struggle to meet basic needs.
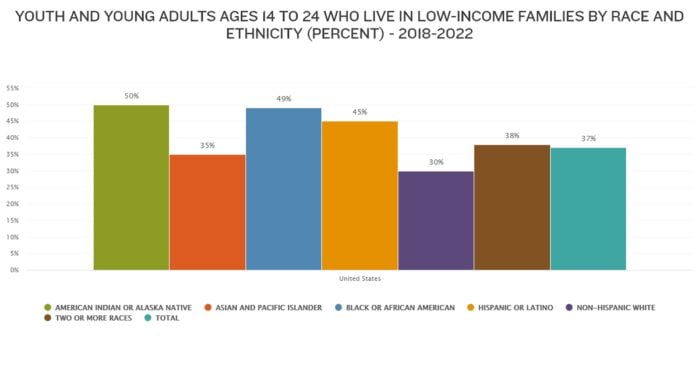
- Nearly 2 in 5 youth and young adults still live in low-income families: The share of young people ages 14 to 24 in low-income households reached an alarming high of 45% in 2010–14 and has since declined to 37% in 2018–22. While this is progress, the latest figure still equates to about 16.6 million young people living in low-income families (defined as a household income of less than twice the federal poverty level).
- Reflecting long-term inequities, American Indian or Alaska Native, Black and Latino young people disproportionately live in low-income families: Half of American Indian or Alaska Native (50%) and Black (49%) youth ages 14 to 24, and almost half of Latino youth (45%), lived in low-income households in 2018–22. Shares were lower for multiracial (38%), Asian and Pacific Islander (35%) and white (30%) young people. At the same time, these figures improved for all racial and ethnic groups since 2010–14, and racial disparities narrowed slightly during this period.
- Rates for low-income youth in immigrant families largely mirrored those of the general population: Similar to the overall trend for youth and young adults, about 2 in 5 (39%) young people ages 14 to 24 in immigrant families were living in low-income households in 2018–22, down from 51% in 2010–14. Among states with data in 2018–22, this figure ranged from a low of 25% in New Hampshire to a high of 54% in Mississippi.
Household Resources: Housing Costs, Food Security and Digital Access
- More than 1 in 4 youth and young adults experience high housing cost burdens: In 2018–22, 28% of young people ages 14 to 24 lived in households with high housing cost burdens — meaning more than 30% of monthly income was spent on housing. This figure has stagnated in recent years, but it is down from 35% in 2006-10. In 10 states and the District of Columbia in 2018–22, shares of youth experiencing high housing cost burdens were even higher than the national average. See more on housing security trends.
- Black and Latino young people are most likely to face high housing cost burdens: At least 1 in 3 Black (36%) and Latino (34%) youth and young adults ages 14 to 24 lived with high housing cost burdens in 2018–22, followed by Asian and Pacific Islander (30%), multiracial (30%), American Indian or Alaska Native (26%) and white (22%) young people.
- One in 8 experienced food insufficiency in the fall of 2022: According to a Census Bureau survey from Oct. 5–Nov. 14, 2022, 13% of young adults ages 18 to 24 did not have enough to eat in the past week. This share reached at least one in five in the following states, out of 21 states with data: California (20%), Louisiana (22%), Iowa (26%) and Kentucky (29%). Read about food insecurity in America.
- More than 3 in 4 youth and young adults have a computer and internet at home: While most (78%) young people ages 14 to 24 live in households with access to a computer device and high-speed internet, 18 states fell below the national average in 2018–22. Young people in Mississippi were the least likely (63%) to have this digital access at home, whereas those in New Hampshire were the most likely (88%). Having a computer and high-speed internet at home is increasingly essential for education, employment, health care and other basic needs.
Education
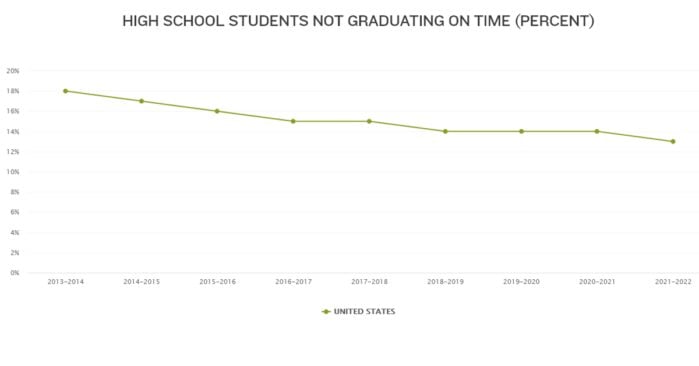
- The U.S. high school graduation rate reached a new high of 87%: In 2021–22, 13% of high school students did not graduate on time, an improvement of 5 percentage points from 2013–14, the earliest year available on the KIDS COUNT Data Center. At the state level in 2021–22, the share who did not graduate on time fell as low as 9% in West Virginia but remained as high as 24% in New Mexico and the District of Columbia.
- All racial and ethnic groups made graduation gains but disparities remain: While timely high school graduation rates improved for all racial and ethnic groups from 2013–14 to 2021–22, inequities in educational opportunities continue to be a problem across the country. American Indian or Alaska Native, Black and Latino students consistently face more hurdles to timely graduation — with 26%, 19% and 17%, respectively, not graduating on time in 2021–22 — compared to white (10%) and Asian and Pacific Islander (6%) students.
- Just under half of young adults had enrolled in or completed a four-year degree, with uneven attendance across the country: In 2022, 48% of adults ages 18 to 24 were enrolled in college or had graduated, a statistic that’s been relatively even since 2010. College attendance varies widely across the nation, though, with more than 3 in 4 (77%) young adults in the District of Columbia either enrolled in or finished with college in 2022, the highest rate in the country that year, while the lowest rate occurred in Alaska (24%). See differences by race and ethnicity.
The Transition to Adulthood
- Fewer young people ages 16 to 24 are disconnected from work and school than a decade ago, but over 4 million still need support: In 2022, 11% of youth and young adults were neither in school nor employed, an improvement from 14% (or 5.6 million) in 2012. However, the latest figure still represents more than 4.3 million young people who are detached from education and work and need support re-engaging in these settings. See disparities in youth disconnection rates by race and geography.
- More than 2 in 3 young adults were employed in the fall of 2022: Census Bureau survey data from Oct. 5–Nov. 14, 2022, found that 68% of adults ages 18 to 24 reported being employed in the past week. Among states with available data at that time, shares ranged from fewer than half (45%) of young adults with employment in Mississippi to about 9 in 10 (89%) in Missouri.
- Yet nearly 2 in 5 young adults still had difficulty paying for basic expenses: The same fall 2022 survey showed that 38% of 18- to 24-year-olds reported difficulty covering usual household expenses, such as rent, health care or student loans. This was true for more than half of young adults (53%) in Maine and New Mexico, the highest figures in the country among states with data.
Health and Safety
- Just over 1 in 10 young people ages 14 to 24 do not have health insurance: According to 2018–22 data, 89% of youth and young adults have health insurance, an increase from 79% in 2008-12. While this is significant progress compared to a decade ago, 11% of this population continues to lack coverage. Among racial and ethnic groups, more than 9 in 10 (93%) white and Asian and Pacific Islander young people had insurance in 2018–22, exceeding the national average, while much smaller shares of American Indian or Alaska Native (78%) and Latino (82%) youth had coverage. State-level rates are similarly disparate: only 77% of young people in Texas were insured in 2018–22, compared to 97% in Massachusetts.
- Uninsured rates are worse among adults ages 18 to 24, with about 1 in 6 lacking coverage: Although it is encouraging that most young adults (92%) report being in good health, a fall 2022 Census Bureau survey found that 17% of young adults did not have health insurance. This was an increase from survey findings earlier that year.
- About 1 in 10 youth ages 12 to 17 abuse alcohol or drugs: In 2021–22, 9% of adolescents in this age group reported a dependence on or abuse of illicit drugs or alcohol in the past year. Illicit drug use includes the misuse of prescription psychotherapeutics or the use of marijuana, cocaine (including crack), heroin, hallucinogens, inhalants or methamphetamines. Across the country, these reports of alcohol or drug abuse ranged from 5% in Utah to 16% in New Mexico.
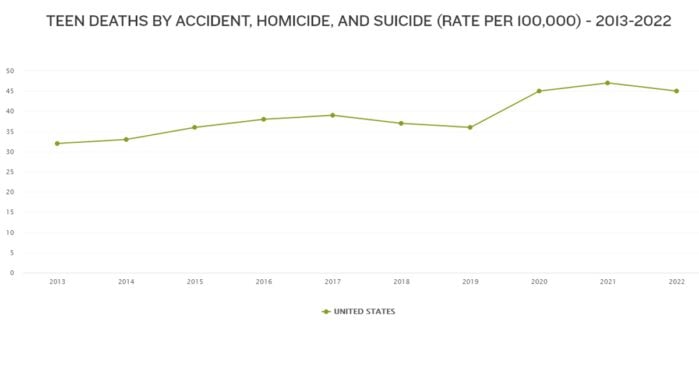
- Teen deaths due to leading causes declined in 2022 after a two-year spike: The leading causes of death for youth ages 15 to 19 are accidents or unintentional injuries, homicides and suicides. The teen death rate due to these causes fell in 2022, to 45 per 100,000, after sharply rising in 2020 and 2021. However, this rate is still up by 41% compared to a decade earlier in 2013. Underlying causes for the overall rise in teen deaths include drug overdoses and firearm-related homicides.
- Black and American Indian or Alaska Native youth consistently have the highest death rates: The KIDS COUNT® Data Center provides the teen death rate from all causes by race and ethnicity. In 2022, the Black teen death rate was nearly twice the national rate, at 111 versus 59 deaths per 100,000 youth ages 15 to 19, and higher than rates for all other racial and ethnic groups. The American Indian or Alaska Native teen death rate — 84 per 100,000 in 2022 — also remained well above the national rate and figures for Latino, white, multiracial and Asian and Pacific Islander youth. See trends and leading causes of death for each group.
Mental Health
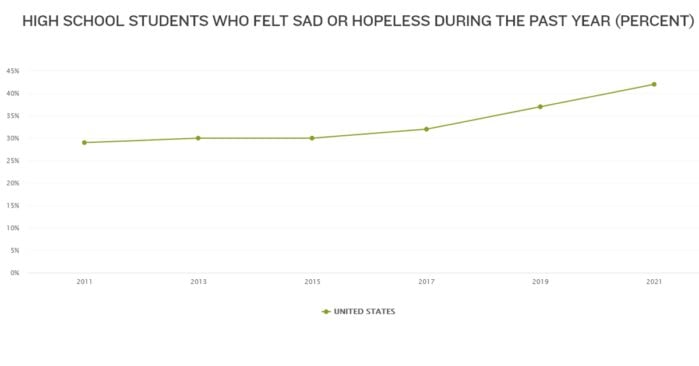
- Persistent feelings of sadness and hopelessness surged by almost 50% among U.S. high schoolers. From 2011 to 2021, the share of high school students reporting that they felt so sad or hopeless for two weeks in a row that they stopped doing usual activities rose from 29% to 42%, a large and concerning increase.
- One-third of young adults also report persistent depressed or hopeless feelings: According to a Census Bureau survey in the fall of 2022, 33% of adults ages 18 to 24 felt down, depressed or hopeless for more than half of the days or nearly every day for the past two weeks. An even larger percentage (44%) of young adults reported persistent nervous, anxious or on-edge feelings at that time.
Young Parents
- Fewer young adults are becoming parents: The share of adults ages 18 to 24 who are parents has been declining for decades, with a recent drop from 10% in 2006-10 to 6% in 2018–22. The number of young parents fell accordingly, from 3.2 million to 1.8 million in the same period. The share of young parents also declined for all racial and ethnic groups — falling by 50% for Black and Latino young adults and by 44% for American Indians or Alaska Natives — and all states from 2006-10 to 2018–22.
- The teen birth rate has plummeted by almost 80% in recent decades: Between 1990 and 2022, the rate of births to teens ages 15 to 19 fell by 77%, from 60 to 14 per 1,000. In numbers, this was a drop from 521,826 to 143,789 births. Rates dropped for all states during these three decades, as well. Data by race and ethnicity are available for a shorter period from 2016 to 2022 and also showed declines for all groups during this time. See births to younger teens compared to older teens.
More Data and Resources on Youth and Young Adults
Today’s youth and young adults are part of Generation Z, which spans ages 12 to 27 in 2024. See the Foundation’s many resources on Gen Z:
- Generation Z and Mental Health
- Social Issues Important to Generation Z
- What the Statistics Say About Generation Z
- Core Characteristics of Generation Z
- Generation Z and Education
KIDS COUNT® Data Center indicators on Gen Z and other generations:
- Gen Z population size, by race and ethnicity
- Gen Zers living in poverty
- Gen Zers in poverty by race and ethnicity
- Gen Zers living in low-income households
- Gen Zers in low-income households by race and ethnicity
Access all youth and young adult data on the KIDS COUNT Data Center, and learn more about the challenges facing youth, as well as opportunities to support them, in the Annie E. Casey Foundation’s Thrive by 25 announcement.
Sign up for our newsletters to get the latest data, reports and resources